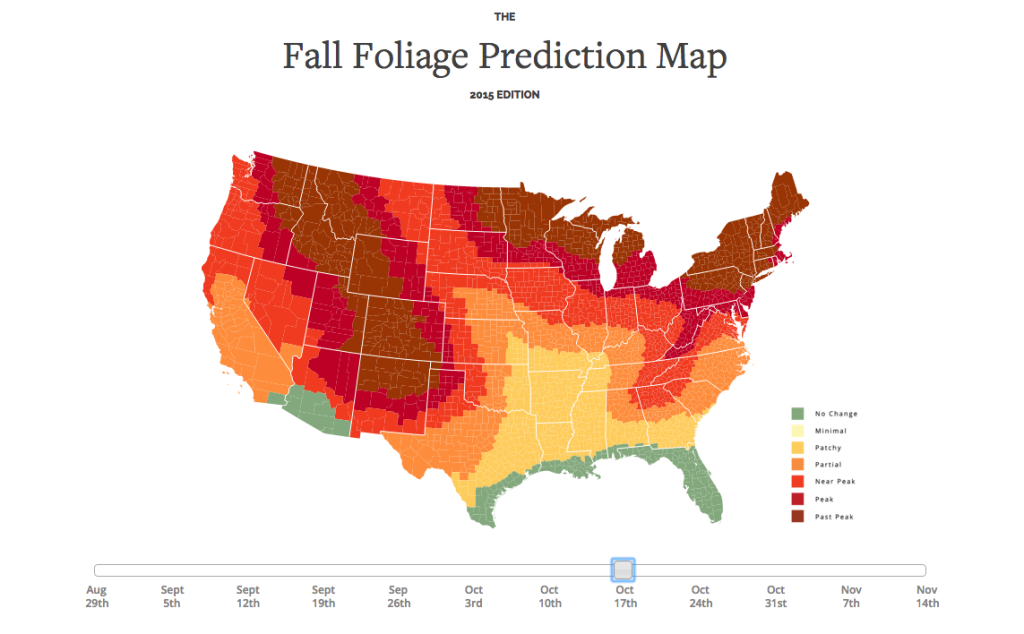
In the event you’re planning your fall color photo trips SmokyMountains.com has an interactive map predicting this stages of fall color nationwide over the course of late August to mid November. The map has 37,000+ data points generated by an algorithm that takes into account NOAA precipitation forecasts, daylight and temperature forecasts and historical precipitation. Predictions are incredibly difficult for fall color due to a variety of factors including temperature, amount of sunlight, precipitation and moisture soil. In addition wind can wreak havoc with the most thoughtful predictions. While I wouldn’t rely on this 100% it certainly should be referenced in conjunction with week to week weather forecasts for areas you’re looking to photograph.
Make the most of this resource and happy shooting!

